Performance KPIs
At the top of the Analytics dashboard, six high-level metrics give you an immediate snapshot of your platform’s performance based on your selected date range:Total Calls
The absolute volume of inbound and outbound calls processed.
Total Minutes
The aggregate number of voice minutes consumed.
Success Rate
The percentage of calls where the agent successfully completed its objective.
Avg Duration
The average length of your real-time conversations.
Active Agents
The number of unique AI agents that fielded calls during the period.
Sentiment
The overall average sentiment (positive/neutral/negative) of your callers.
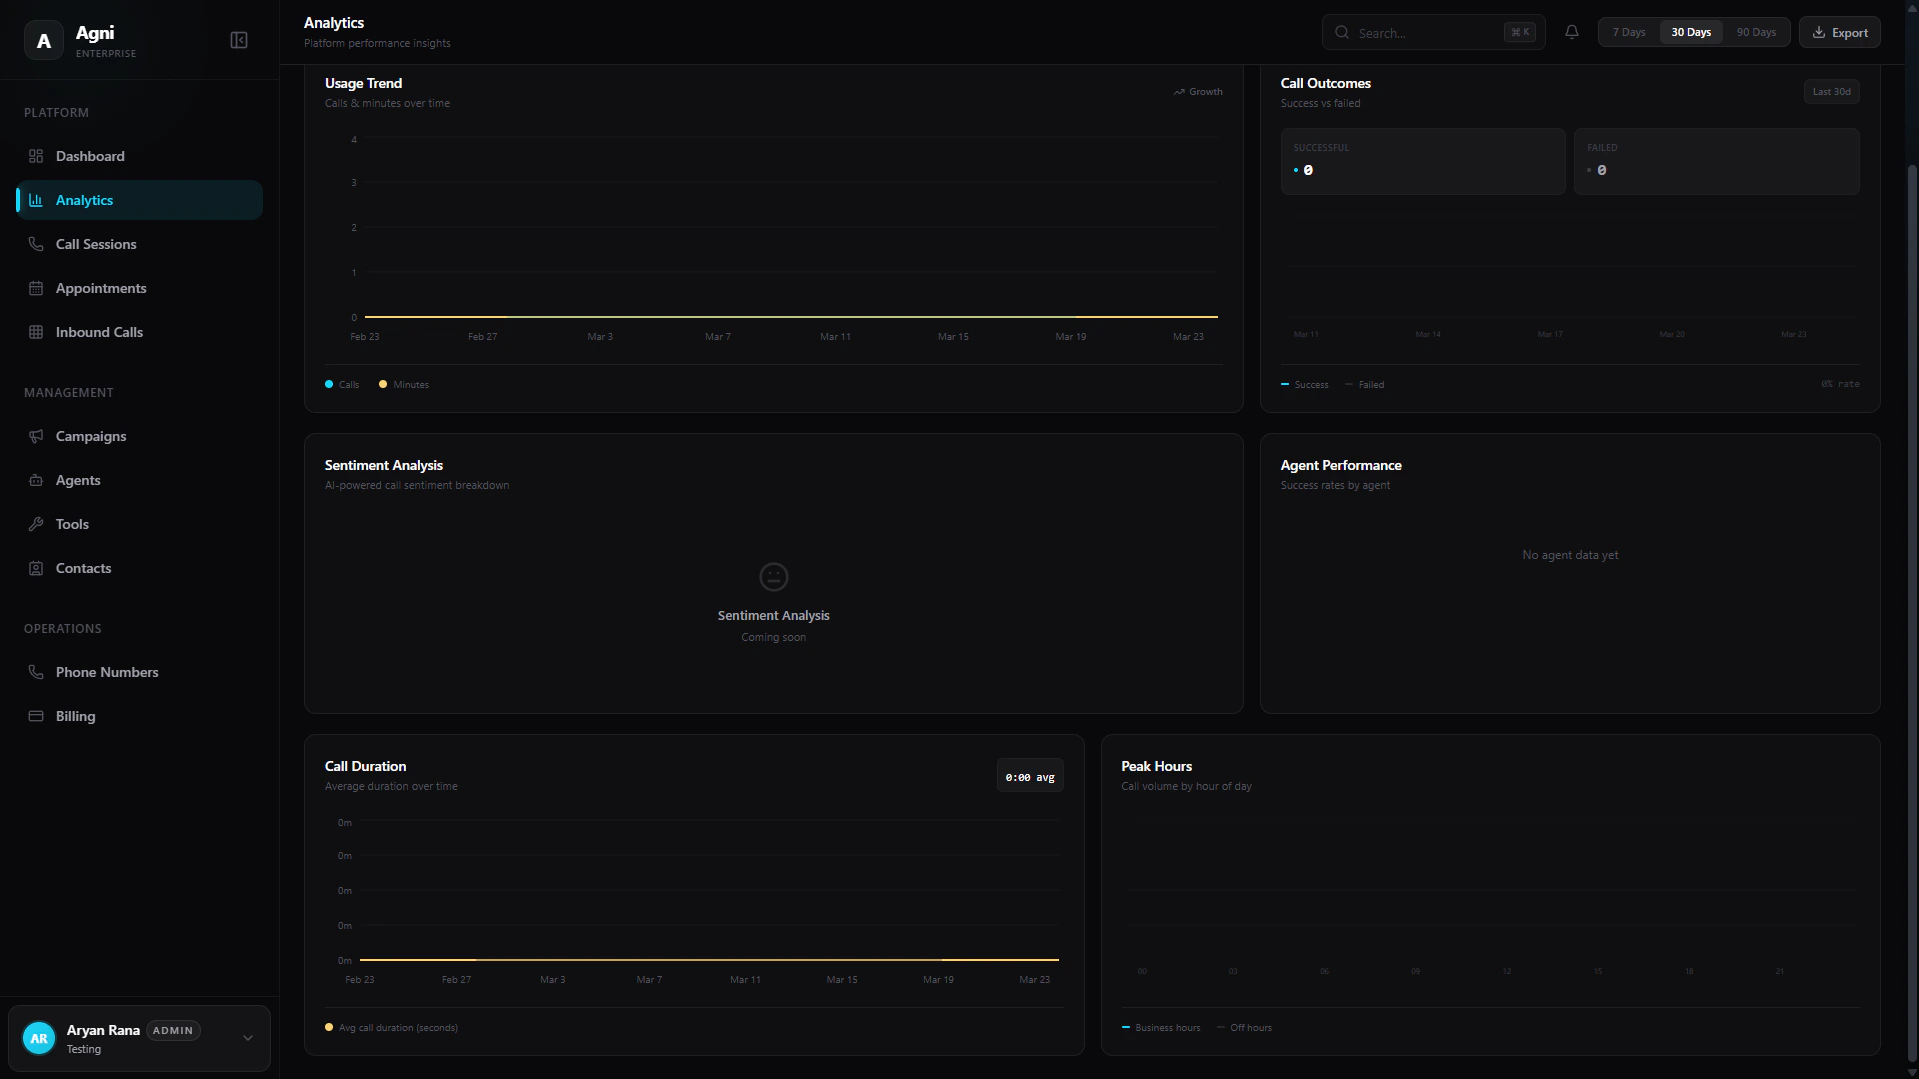
Visualizations & Trends
Agni provides a powerful suite of interactive charts to help you visualize data trends and optimize your agents’ performance.Usage Trend
Tracks calls and minutes over time. Because Agni operates on a usage-based pricing model, this chart directly correlates to your platform spend and growth.
Call Outcomes
A comparative breakdown plotting Successful versus Failed calls, allowing you to quickly spot routing issues or prompt inefficiencies over time.
Sentiment Analysis
An AI-powered breakdown of caller sentiment based on conversational analytics. (Note: This feature is rolling out soon).
Agent Performance
Compares success rates across different agent deployments. Use this to A/B test system prompts, voices, or tool configurations.
Call Duration
Plots your average call duration in seconds over time, helping you measure agent efficiency and conversation length.
Peak Hours
Visualizes call volume by the hour of the day, split between Business hours and Off hours to help you understand concurrency demands.
Filtering and Exporting Data
In the top right corner of the dashboard, you can control the scope of your analytics to generate custom reports:Filter by Date
Use the quick-select pills (7 Days, 30 Days, 90 Days) or the date picker to instantly recalculate your dashboard metrics for a specific timeframe.